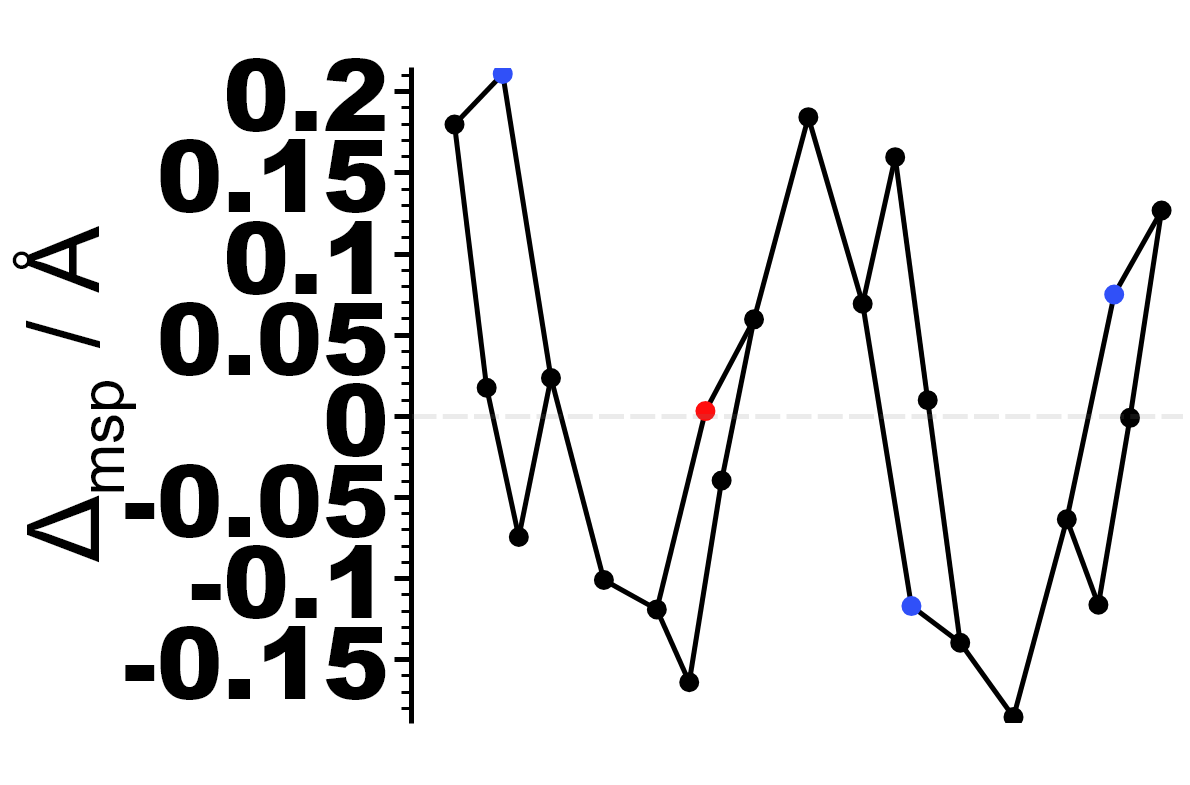
Graph

Axis Format
Section titled “Axis Format”The default format of the axis label. {0} being quantity {1} being unit (default: {0} / {1})
Axis Thickness
Section titled “Axis Thickness”The Thickness of the axis and ticklines is determined by this value (default: 4 px)
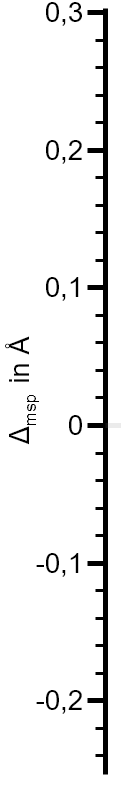
Y Axis Label Rotation
Section titled “Y Axis Label Rotation”Rotation of Y Axis Label (default: -90 °) (Image shows result when padding is not adjusted)
Y Axis Label Position
Section titled “Y Axis Label Position”Y Position of the axis label, 1 being top, 0 being bottom (default: 0.5 = middle)

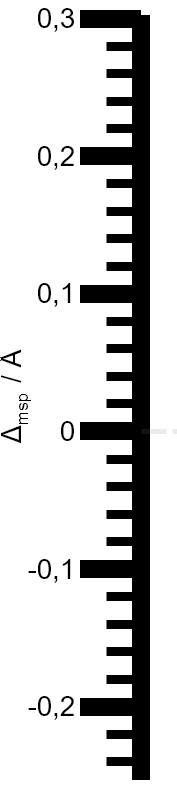
Y Axis Label Padding
Section titled “Y Axis Label Padding”Additional Distance between Axis Label and axis (default: 0) (Image shows result with Rotation and Padding 30)

Show X Axis
Section titled “Show X Axis”Toggles the visibility of the X Axis (default: off)
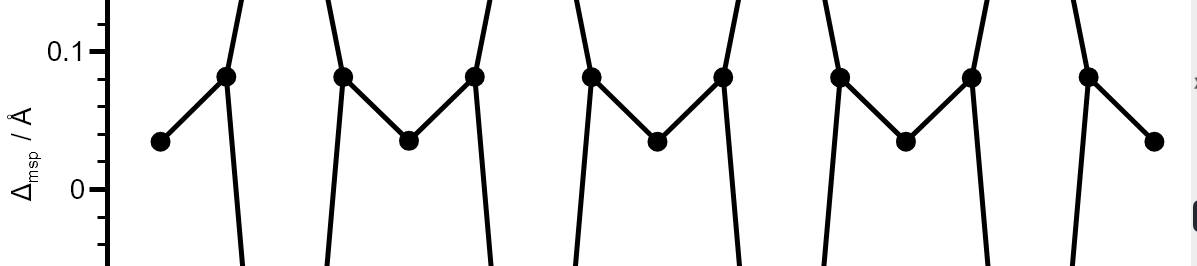
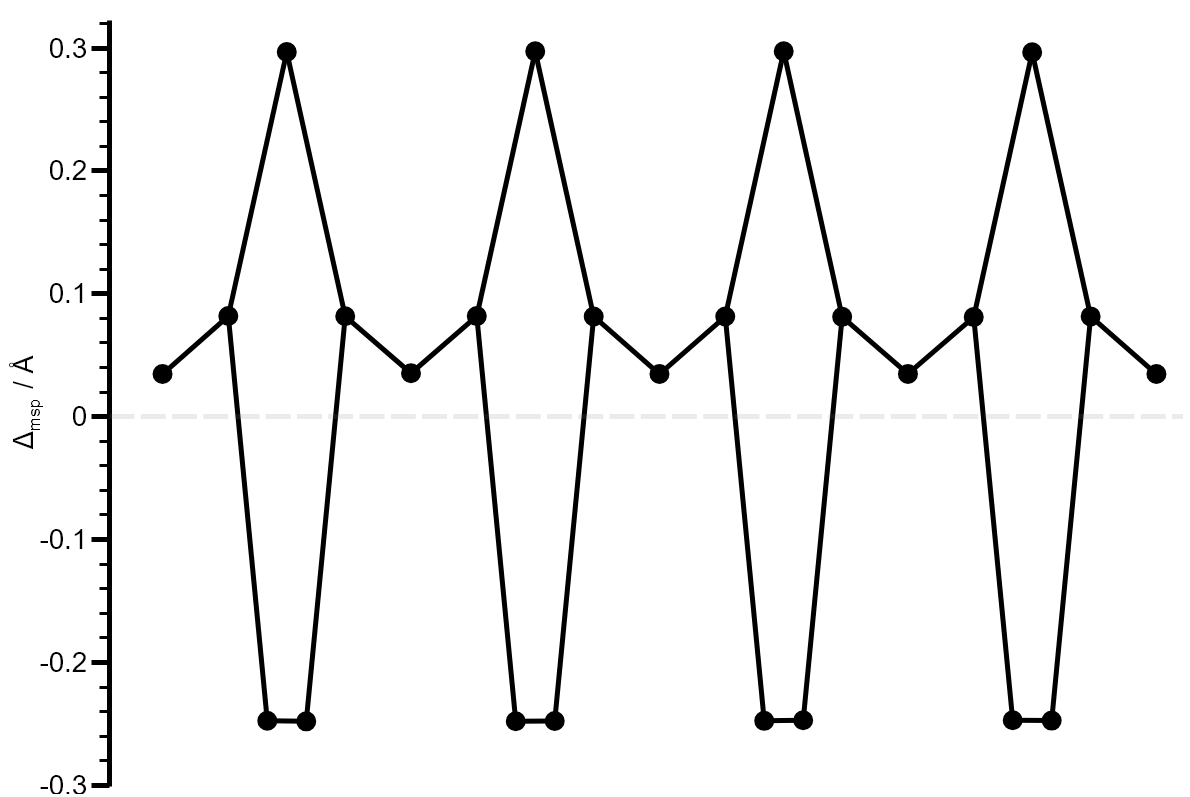
Show Zero
Section titled “Show Zero”Shows a gray line for y = 0 (default: on)
Series
Section titled “Series”Marker Size
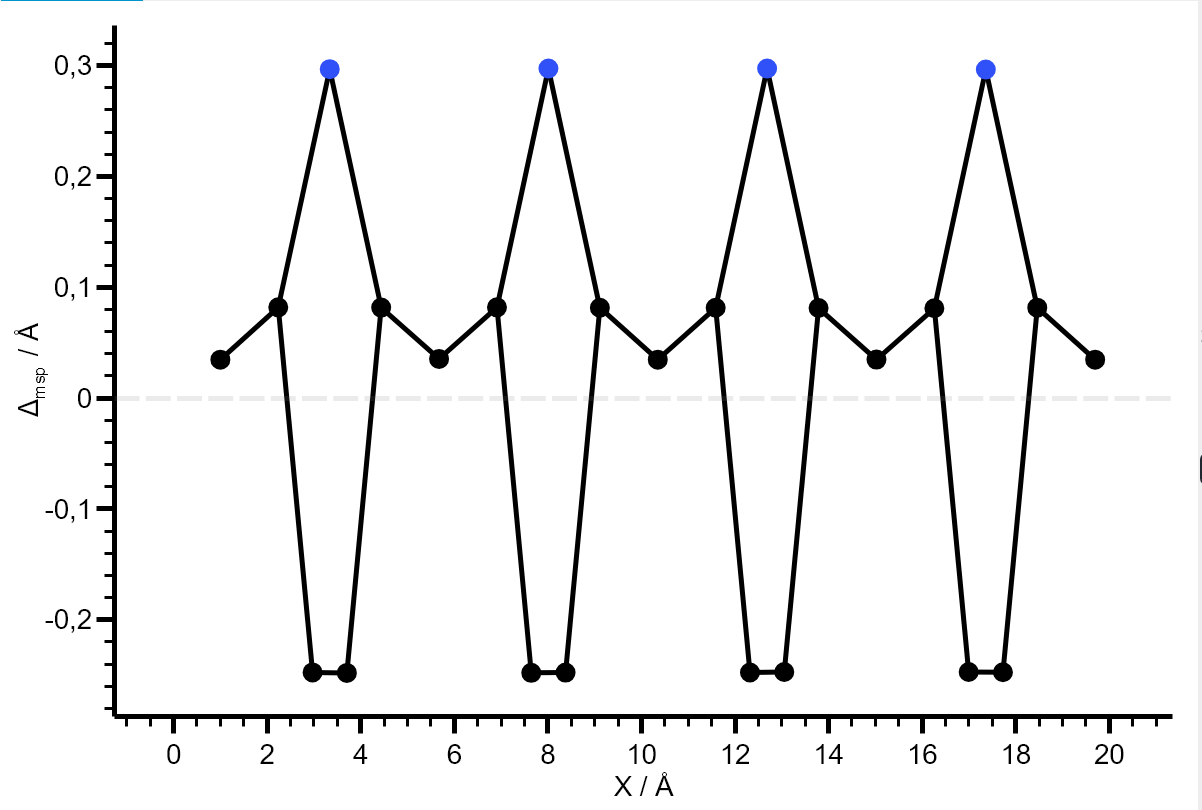
Section titled “Marker Size”Marker size adjusts the size of atoms in the displacement diagram. Image shows size set to 18

Use Single Marker Color
Section titled “Use Single Marker Color”Uses the same color for atoms as for bonds. Useful when doing comparisons of multiple structures. (default: off)
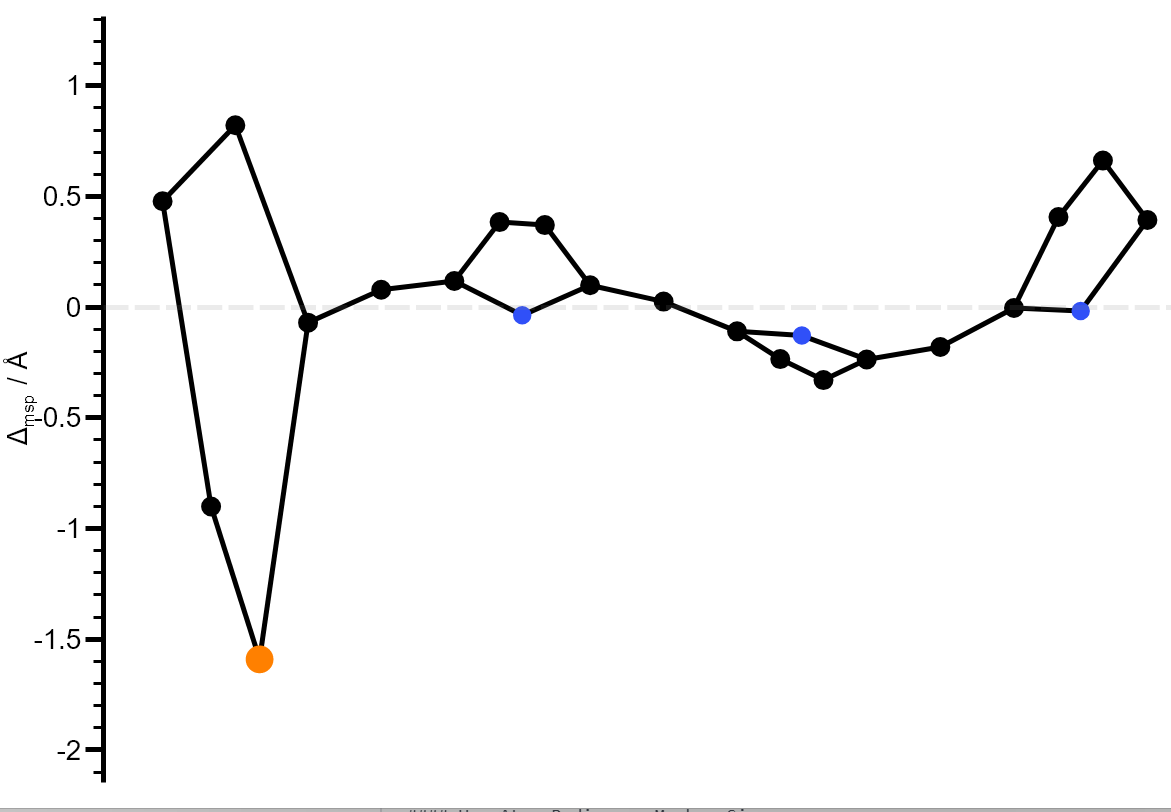
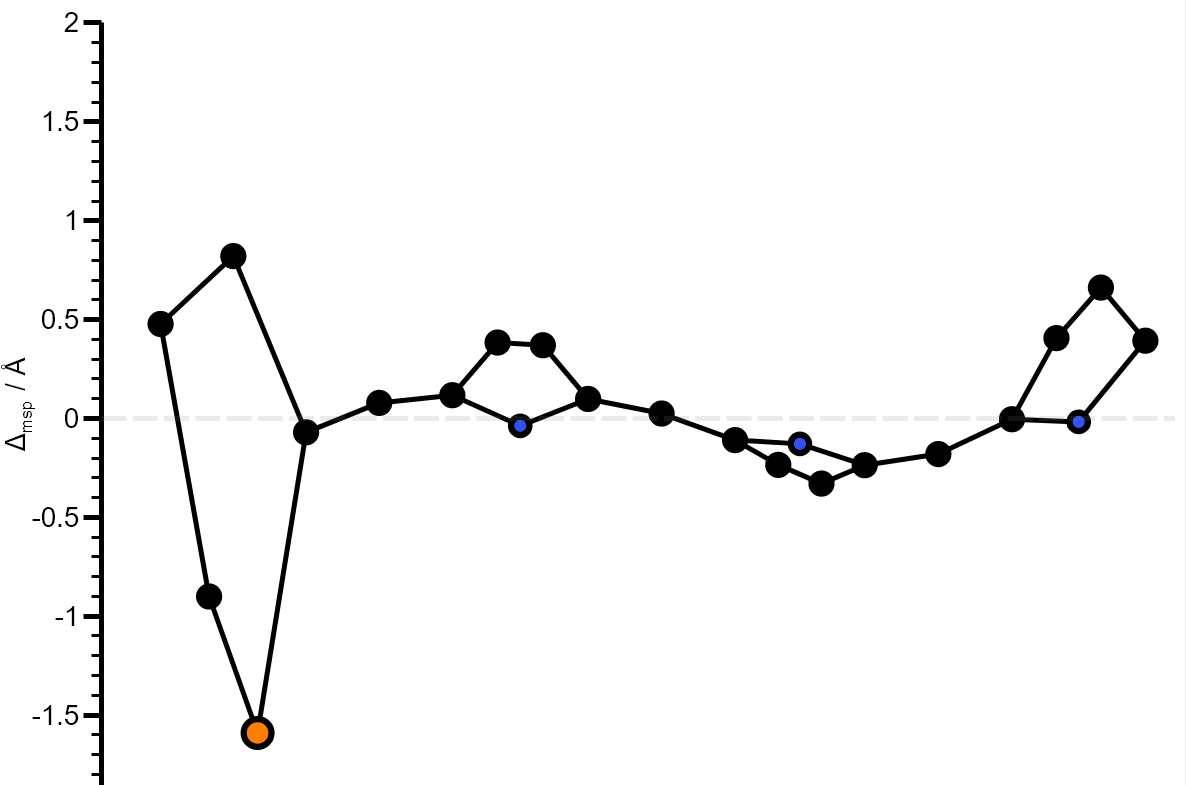
Use Atom Radius as Marker Size
Section titled “Use Atom Radius as Marker Size”Sizes atoms in displacement diagrams based on their atomic radii. The orange one is phosphorous for example
Marker Border Thickness & Marker Border Color
Section titled “Marker Border Thickness & Marker Border Color”Adds a border around the atom markers in the displacement diagram in the given color.
Bond Thickness
Section titled “Bond Thickness”Thickness of the bond line in the displacement diagram. Image shows value set to 10.

Plot Area
Section titled “Plot Area”Plot Area Border Thickness
Section titled “Plot Area Border Thickness”Adds a border around the whole displacement diagram when set to anything other than 0. Image shows value set to 2
Padding
Section titled “Padding”Adds a Padding around the plot (default: 8) Image shows value set to 20 px.
Font Family
Section titled “Font Family”The Font used in the displacement diagram. (default: Arial). Image shows value set to Times New Roman

Font Size
Section titled “Font Size”Gives the font size used in px. (default: 14). We often use 22, 30+ is recommended for smaller images
Font Weight
Section titled “Font Weight”The weight of the font used in the displacement diagram. 500 is normal, 900 is black. The Image shows a font size of 80 with a weight of 900.