Introduction
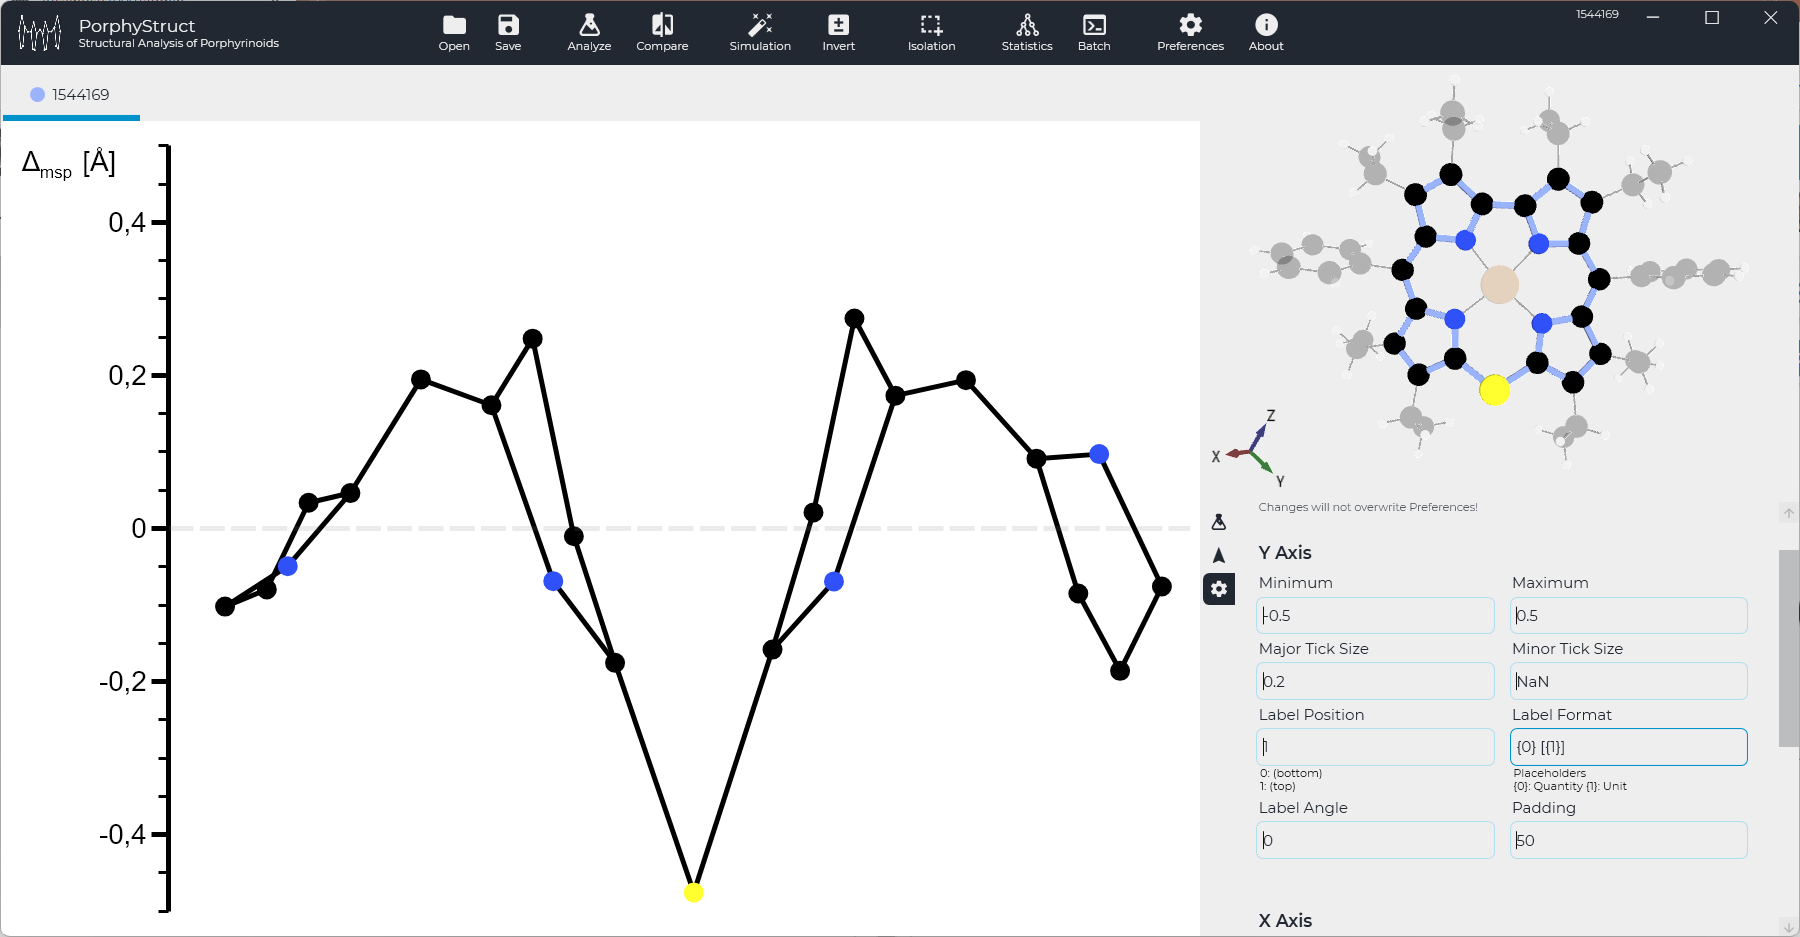
A quick and easy way to customize plots via the quick settings menu is shown here. The quick settings menu can be opened by clicking the settings icon in the bottom right tab menu. The menu content is shown in the image below.
Y-Axis Settings
The most common settings are categorized as Y-Axis. Mostly Minimum and Maximum need to be changed. To compare individual graphs we set the axis to the same value chapterwise. For corroles mostly -0.5 to 0.5 is a good option.
Major and Minor Tick Size set the distance a tick occurs on the y axis. We usually use either 0.2 or 0.5 for the Major Tick Size and leave Minor Tick Size as default (NaN = auto).
Applying these settings the Graph above will change to:
Label Position gives the percentage value of the position of the Y-Axis label. 1 beeing top, 0 being bottom.
Label Angle sets the rotation of the Y-Axis Label. -90 is the default setting, 0 will result in horizontal text.
When changing these settings the gap has to be enlarged. The following figure will feature a Padding Value of 50.
Label Format formats the Quantity {0} and Unit {1} Text. Default being {0} / {1}. The following figure has this value set to {0} [{1}].
X-Axis Settings
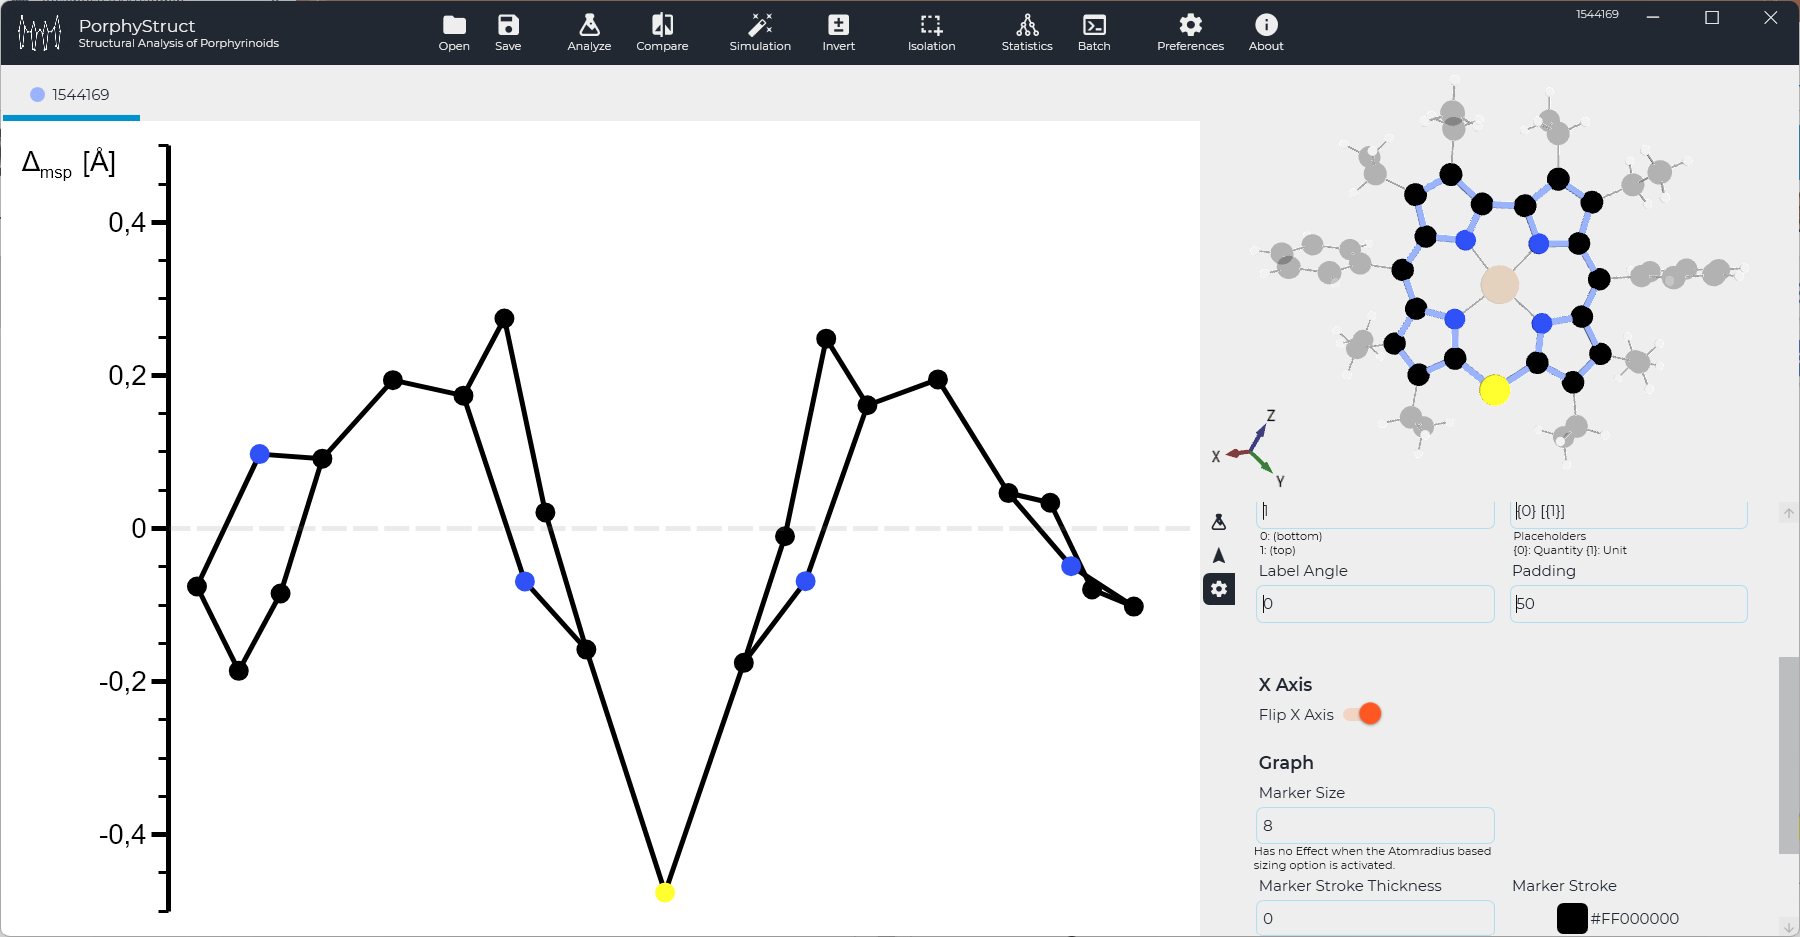
The only option in this category is Flip X Axis which does exactly that. To flip the Y Axis use the "Invert" Button in the Toolbox.
Graph Settings
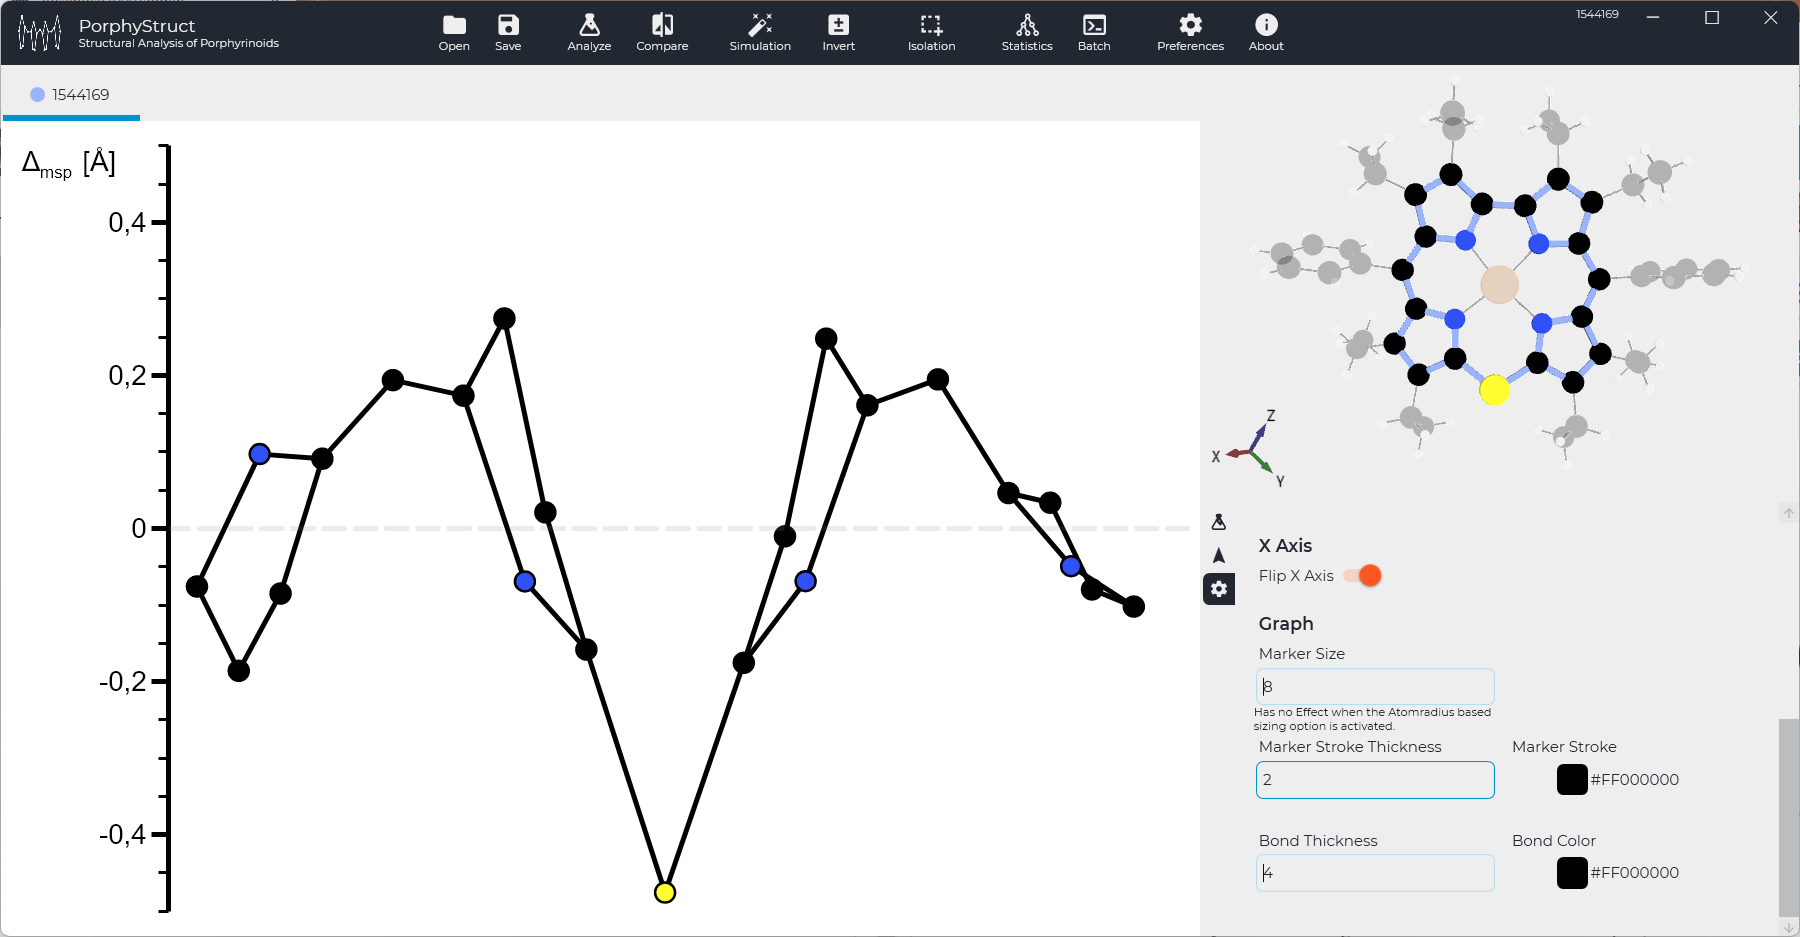
This category contains settings for color and size of the atoms and bonds in the graph. Also a border can be added to atoms to enhance visibility. Marker Size gives the size of the Atoms in the plot, Bond Thickness the thickness of the bond lines. Marker Stroke Thickness adds a border to each atom. There are also two options for color adjustments of bonds and the border around atoms. The following figure shows a border added to the atoms with a size of 2 increasing visibility for the S-Atom in 10-Position of this Thiacorrole.
Exported Image
With all above settings applied the image has been exported. The result is shown here:


